

By Jeffrey Napierala, PhD and Julia Colyar, PhD
Executive Summary
This report examines trends in the representation of women in full-time university faculty positions in Ontario. It utilizes data from Statistics Canada’s University and College Academic Staff Survey, which contains high-quality information dating back to 1970. The primary focus is on gender differences across academic ranks, discipline and provinces and has been to explore the magnitude of current and historical disparities. Interactive visualizations are utilized for the analysis and allow readers to explore data on their own in new and unique ways.
Below are some of the key findings:
- Women constitute just 39% of all full-time university faculty in Ontario. This is the same percentage as for Canada as a whole.
- There has been a tremendous increase in women faculty over time — particularly during the 1990s and 2000s, when the percentage nearly doubled — but growth has slowed in recent years.
- At the current rate of growth, women will not reach parity with men in faculty positions until 2070. Parity in STEM disciplines will take even longer.
- Women’s overall gains in representation obscure continued disparities in STEM disciplines.
- Women make up 58% of faculty in fields stereotypically considered more feminine, such as education and health, whereas women make up just 21% of STEM faculty.
- Women account for nearly 50% of assistant professors, but are underrepresented at the higher faculty ranks, making up just 29% of full professors.
Findings from this report underscore the need to understand equity for women faculty in more complex ways. Equity will not be reached when women simply reach 50% of all faculty if they continue to be underrepresented in senior positions and concentrated in traditionally feminine disciplines. Future work in this area should collect and explore longitudinal data to better understand differences in the career trajectories of men and women in different institutional settings. An intersectional approach, facilitated by more ample data sources, will also be critical for developing a more complete understanding of equity among Ontario faculty.
Introduction
Widespread awareness and efforts to increase women’s representation in university faculty roles have helped address overall gaps in Canada. Women’s gains, however, are not evenly distributed across academic disciplines. This report examines trends in the representation of women across academic ranks and disciplines to explore the extent of current and historical disparities. In particular, we focus on science, technology, engineering and mathematics (STEM) disciplines due to the continued lack of women entering and progressing through to senior positions in these fields. Interactive data visualizations also provide readers the ability to explore trends in new and unique ways. The intent is to facilitate greater awareness of the ongoing struggle for equality that women face in academia in Ontario.
Background
The representation of women in university faculty positions has increased over time but has not reached parity with men. As discussed in Canadian Academia and the Faculty Gender Gap, the underrepresentation of women faculty can be understood in terms of individual, cultural and structural barriers that overlap and shape women’s experiences in early education and professional socialization. Great strides have been made but it wasn’t until the 1970s and 1980s that Canada began to officially support the idea of gender equality and implemented legal and ethical frameworks to combat gender discrimination (Council of Canadian Academies, 2012, p. 28).
The transition to more equitable workplace policies is often attributed to structural changes to the economy and changes in social norms and beliefs that previously did not support the full participation of women — particularly married women — in the labor force (Fernández, 2013). In Canada, it was not until the post-World War II era that women’s labor force participation began to increase from very low levels (Statistics Canada, 2018). This corresponded with increases in the percentage of women with university and college degrees — increases which led women to surpass parity with men in this category in the early 1990s (Ferguson, 2016). However, the percentage of women in university faculty positions is still far from parity with men (Statistics Canada, 2019b, Wang & Doolittle, 2021).
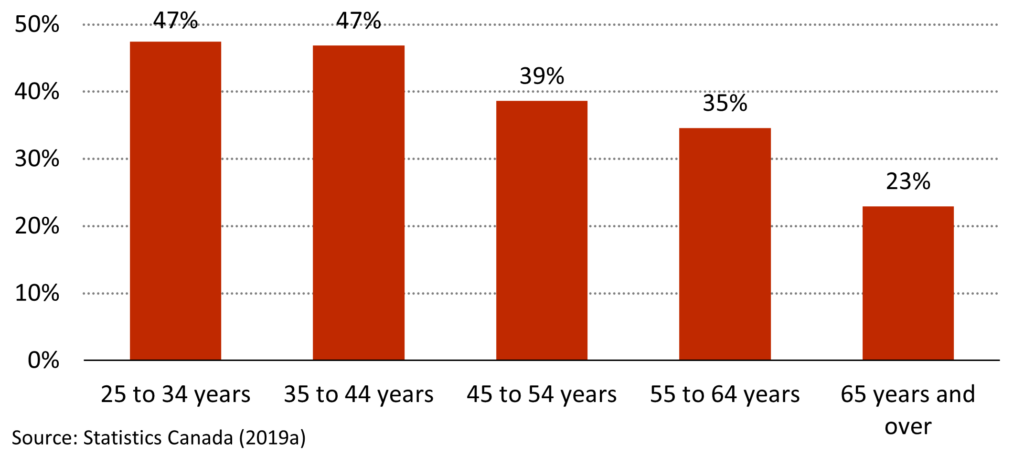
Continued disparity is due, in part, to an underrepresentation of women among individuals who hold doctorate degrees. This is important since doctorates are commonly required for tenure-track, permanent positions in the university context.[i] Figure 1 shows the distribution of women[ii] with doctoral degrees in Ontario (Statistics Canada, 2019a). Across all age groups, women represent 38% of all doctorate holders, but there are substantial differences by age, which reflect the constrained opportunities of earlier cohorts of women. In 2016, 47% of younger doctorate holders were women, but this drops to 23% when looking at doctorate holders aged 65 and over. With the historical underrepresentation of women in the academic pipeline, a wide gap currently exists between men and women in full professor roles. However, given higher percentages of women in younger cohorts of doctoral degree holders, the percentage of women faculty across academic ranks can be expected to increase into the future.
Figure 1: Percentage of Earned Doctorate Holders that are Women in Ontario, 2016
The representation of women across faculty ranks is also affected by highly structured promotion processes at universities, whereby assistant professors must earn promotion to associate professor by their seventh year. Faculty can be further promoted to full professor and, in some institutions, distinguished/university professor. Promotions are granted based on factors primarily related to perceived performance in teaching and research (Gravestock & Greenleaf, 2008). Consequently, the number of women at the assistant professor rank at any one point in time will closely mirror recent hiring, since everyone’s time in this position is limited in duration, whereas disparities at higher ranks are due to multiple factors that have affected the career trajectories of women and men over extended periods of time.
Research Questions
This report addresses the following research questions:
- How did women’s representation in university faculty positions in Ontario change between 1970 and 2018?
- How does women’s representation differ across disciplines? Are there areas in which women are exhibiting more progress?
- How does representation of women among faculty in Ontario compare to other provinces?
- Given the trends represented in this data, at what point in time might women university faculty in Ontario expect to achieve parity in representation?
Data and Limitations
We use the University and College Academic Staff Survey – Full-time Staff (FT-UCASS) for this report; it is a mandatory census of all full-time teaching staff at universities in Canada. Statistics Canada has conducted FT-UCASS since 1937, except for a small window of time between 2011–12 and 2015–16, when data was collected through other means and retroactively added to the database.[iii]
The data used here begins in the 1970–71 school year, the earliest point for which machine-readable data is available, and continues through the 2018–19 school year. It consists of the gender, academic rank, discipline,[iv] and province of every professor in Canada.[v] We have chosen these characteristics for this analysis since they represent some of the most commonly discussed factors related to gender disparities among faculty. Note that the definition of “academic staff” used here includes full-time tenure-track faculty, full-time research staff that have a similar academic rank and salary scale, and visiting full-time academic staff in faculties only.
Some caution is needed when interpreting these results. For gender, the data collected by FT-UCASS is referred to as “gender” in official documentation; however, only “male” and “female” responses are permitted (and more recently, “other”[vi] for some institutions) (Statistics Canada, 2020a). For this report, we use the terms ‘men’ and ‘women’ despite incongruencies between gender and sex (see Canadian Institutes of Health Research, 2020).
Due to the disruption in FT-UCASS data collection between 2011–12 and 2015–16, results from these years should also be interpreted with caution. During this time, there are particularly large amounts of absent data for the discipline variable; consequently, results for these years may be inaccurate in some cases. In the visualizations below, affected time periods are labeled and shaded grey.
One constraint of FT-UCASS is that it collects a limited amount of information on PSE workers. For example, information is not collected at all from colleges. Part-time and contract instructors at universities, a group which has recently grown in number and has limited job stability (Field et al., 2014), are also excluded. Data on race (or “visible minority”), ethnicity, religion, sexual orientation, Indigenous identity, and disability are not collected consistently across institutions and are not available for this analysis. Despite these limitations, FT-UCASS remains the highest quality source of historical data on gender for university professors in Canada.[vii]
Results
Results in this report are presented in three interactive data visualizations. Detailed tips and instructions for their use are provided on a separate webpage. A PDF with static images is also available for download. For optimal functionality, data visualizations are best viewed on a desktop device.
Figure 2: Number and Percentage of Full-time University Faculty by Gender
Mobile users please click here to view visualization.
Figure 2[viii] shows trends over time in the count of women and men faculty in Ontario. The number of women faculty has increased steadily since 1970, with gains accelerating in the late 1990s. By 2018–19, there were nearly 5,800 women faculty, compared to just 700[ix] in 1970. In contrast, the number of men faculty increased sharply between 1970–71 and 1991–92, from 7,100 to a peak of 10,700, then fluctuated over the next decades to land at 9,100 in 2018.
As a percentage of all faculty, women increased rapidly from the late 1980s to the late 2000s, from a base of just 12% to 35%, before slowing in recent years. In 2018–19, women represented 39% of all university faculty while men accounted for 61%.
At universities, rank signifies the relative level or seniority of faculty, with full professor being the highest level and assistant professor being the entry level. Because of historical gender disparities in PhD recipients and entry into faculty positions, women faculty in Ontario are currently underrepresented at the full professor rank.
In 2018–19, women represented 47% of assistant professors and 44% of associate professors. However, only 29% of full professors were women. Across all STEM disciplines,[x] women made up 21% of university faculty. However, only 16% of full professors in these disciplines were women. Women’s representation (all ranks combined) in the specific STEM subjects is summarized in Table 1:
Table 1: Percentage of Women Who Were Full-time University Faculty in STEM Disciplines, 2018–19
| Subject Taught | Women | Men | N |
| Architecture, engineering & related technologies | 18% | 82% | 522 |
| Mathematics, computer & information sciences | 21% | 79% | 288 |
| Physical & life sciences & technologies | 25% | 75% | 570 |
The percentage of women in STEM-related fields is increasing over time, but quite slowly. On the other hand, women’s representation in areas such as health and education — disciplines traditionally seen as feminine[xi] — has increased rapidly. In 2018, women made up 58% of faculty and 49% of full professors in these fields.
Figure 3: Percentage of Women in Full-time University Faculty Positions, by Province
Mobile users please click here to view visualization.
Figure 3 shows the percentage of women faculty in each province over time. Although there are small differences between provinces, there has been a similar rate of change in the overall representation of women over time. In 2018–19, Nova Scotia and Manitoba had the highest percentages of women, at 42% and 40%, respectively, followed by Ontario and Saskatchewan at 39%. In the rest of the provinces, women accounted for 38% of the total faculty.
Figure 4: Projections for the Percentage of Full-time University Faculty Who Are Women
Mobile users please click here to view visualization.
The final figure displays projections[xii] for Ontario women faculty 10 years into the future, as a continuation of the trend since 1970.[xiii] The projection is that women faculty will increase slowly over time, increasing from 39% in 2018–19 to just 41% in 2028–29. If the projection is carried forward even further into the future, Ontario women would still not be expected to reach parity in representation until 2070. Parity in STEM fields for women is estimated to take even longer.
Summary and Discussion
This report has presented changes in the representation of women among full-time faculty by academic rank and discipline in Ontario. While the findings cannot speak to all the complexities of these disparities, such as differences due to historical gender imbalances in PhD recipients, they do paint a clear picture of continuous gender disparities over time. Data from FT-UCASS was presented using three interactive data visualizations. We focused on Ontario faculty in STEM-related fields, but readers can use the interactive features of the visualizations to dive deeper and explore other disciplines. The intent of this report is to facilitate an exploration of the complex road to equality that began decades ago.
Overall, women are still underrepresented among faculty in Ontario, accounting for just 39% of all full-time faculty. This is consistent with other provinces in Canada and, generally, more economically developed countries around the world (Council of Canadian Academies, 2012). While there have been tremendous increases for women over time, particularly in the 1990s and 2000s, growth has slowed in recent years. If the more recent rate of growth continues, women would not reach parity with men until 2070.
Overall gains in women faculty’s representation mask persistent disparities in STEM disciplines. There were major gains in education and health, where women now make up 58% of faculty, but women in STEM-related fields have reached only 21% of the total. These findings reflect the issues outlined in Canadian Academia and the Faculty Gender Gap: Women faculty face individual, cultural and structural barriers that hinder their progress into and through faculty ranks. The higher percentages of women in education and health — disciplines more aligned with women’s traditional socialization as caretakers — reinforce concerns regarding the strength of gender stereotypes and cultural norms in shaping women’s professional pathways.
Continued gender disparities are also due in part to historical imbalances in educational attainment and labour force participation. There were fewer women earning doctorates and entering academic positions in earlier time periods. As a result, the older cohorts of faculty, who now occupy the senior ranks, continue to be disproportionately men. If the percentages of men and women with doctorates is used as a proxy for those eligible for faculty positions, women are employed in faculty positions at the same rate as men — 37% of all doctorate holders in Ontario were women in 2016 and 38% of all professorships in Ontario were occupied by women (Statistics Canada, 2019a). Because women have been increasingly obtaining doctorates, they are likely to continue to increase in the professor ranks. However, since the youngest cohorts of doctorate holders still do not reach 50% women (see Figure 1), it is likely that the overall percentage of women faculty will not reach this threshold for an extended period of time, as the forecast above suggests.
The underrepresentation of women in full professor roles likely reflects structural barriers. In particular, research has highlighted the challenges women face in promotion from associate to full professorships. Previous research has shown that women were promoted more slowly than their colleagues who are men, even when accounting for productivity, discipline and institution type (Ornstein et al., 2007; Perna, 2001). Disparities are also amplified for mothers and those who take on service activities in support of students, colleagues and their departments or institutions. Despite changing norms and expectations, women often carry extra burdens that are not typically recognized in tenure systems.
Taken together, these findings underscore the need to understand equity for faculty in more complex ways. While representation is important, it must be achieved without segregating women according to traditional stereotypes — parity in representation is not simply a matter of women faculty reaching 50% overall. Equity is also not reduceable to representation. Within the academic setting, gender stereotypes, cultural norms and institutional structures can negatively shape expectations for women. Equity must be understood to include opportunities, experiences and outcomes for women.
Future research on this topic could expand on these findings in important ways. Additional analysis should be undertaken with longitudinal data to better understand differences in the career trajectories of men and women, such as when they began their first faculty position. When combined with additional information on research productivity (see Millar & Barker, 2020), number of hours worked, and the amount of time spent on university service and mentorship, a more complete model could be developed that would help refine our understanding of the causes of disparities between men and women. Further disaggregation by institution may also be fruitful, as research has noted that equity gaps are more pronounced among top research universities in Canada (Momani et al., 2019; Ornstein et al., 2007).
Further research on this issue should also include an intersectional lens, which will require the collection and reporting of data related to race, ethnicity, religion, sexual orientation, Indigenous identity and disability. Research in other jurisdictions marks the disparities faced by faculty from diverse backgrounds. Until we can examine equity in Ontario and Canada through this lens, our understanding will always be incomplete.
These research approaches should be accompanied by further exploration of the lived experiences of a diversified faculty. The findings presented above point to the strength of cultural values and norms in shaping women’s experiences; these should be further explored in order to support the success of legislative and structural equity efforts.
The next components of the Women in Academia project will pursue some of the issues outlined above. We continue to examine available quantitative data to understand disparities in wages and the number of women continuing through the pipeline from undergraduate studies to full professor positions. Later components will present findings from interviews with women academics, detailing their experiences in STEM fields. The project will conclude with empirically driven policy suggestions.
References
Full reference information can be found here.
Notes
[i] Over 92% of professors in Canada have doctorates, or for medical or paramedical degrees, professional degrees (Statistics Canada, 2020c). However, there are fields that are not counted in this percentage for which a degree type other than doctorate is the terminal credential, such as art, music or design, and some other professional programs.
[ii] Please note that in the 2016 Canadian Census, Statistics Canada only collected information on sex, not gender, of the respondent. We have chosen to substitute nouns for gender in replacement of those for sex for the sake of consistency. Please see the additional discussion in the “Data and Limitations” section on this topic.
[iii] FT-UCASS was terminated in 2012 due to budget reductions and reinstated in 2016. The five-year gap in Statistics Canada’s data collection, between 2011 and 2015, was retroactively filled by a combination of data collected independently by participating institutions in association with the National Vice President’s Academic Council, which authorized and finalized their data with Statistics Canada, as well as data that was independently submitted to Statistics Canada. However, not all institutions participated in this data collection.
[iv] The “primary grouping” variant of Classification of Instructional Program (CIP) codes is used, which consists of 12 groups. Responses classified as “other” or “not available” are not shown in the visualizations due to small counts.
[v] The data used in this report is from a custom Statistics Canada tabulation. Counts are probabilistically rounded to multiples of 3 except those less than 3, which are suppressed by Statistics Canada, and are rounded down to 0 for this analysis. As a result, data presented here may not exactly match that from other sources. Also note that all three-year moving averages and forecasted values presented below are calculated using Microsoft Power BI software.
[vi] Respondents could select from two “genders,” “female” and “male”, until 2013, after which time respondents at some institutions could also select “other” for gender, although it is not possible to separate them from an “unknown” response in the data file. During this time three individuals selected “other” or their gender was unknown (Statistics Canada, 2020b); due to small numbers they are unable to be examined accurately using this data source.
[vii] The Survey of Postsecondary Faculty and Researchers (SPFR) was conducted in 2019 by Statistics Canada and collected more detailed information than FT-UCASS directly from respondents (Statistics Canada, 2019c). However, historical data is not available through this source, and as such, is not suitable for this report.
[viii] The interactive visualization can be adapted to display the count or percentage of women and men faculty since 1970 for any combination of academic rank, subjects taught and province. This can be used to examine the trends for men and women faculty with various characteristics over time.
[ix] Numbers in the text are rounded to the nearest 100.
[x] Here defined as mathematics, computer and information science, physical and life sciences and technology, and architecture, engineering and related technologies.
[xi] In both 1992 and 2007, for example, health and education fields has the largest proportion of female university graduates (McMullen et al., 2010).
[xii] The forecast is computed through a statistical method known as exponential smoothing. The dashed line is the point estimate or “best guess” for the future trend and the shaded cone represents a 95% confidence interval.
[xiii] Note that adjusting the “years for forecast” range in the interactive menu affects the range of data used to compute the forecasted values.